June 28, 2026 · Updated September 13, 2026
How to Calculate Win Rate, R:R and Expectancy in Trading
Three numbers determine whether you have a trading edge: win rate, risk-to-reward ratio, and expectancy. Most traders track one or two of them. Almost no one calculates all three correctly, or understands how they interact.
This guide explains how to calculate each one, what the numbers mean, and how to use them to make better trading decisions.
1. Win Rate
Win rate is the percentage of trades that end in profit.
Formula: Win Rate = (Number of Winning Trades / Total Trades) × 100
Example:
- 37 winning trades out of 60 total
- Win Rate = (37 / 60) × 100 = 61.7%
What Win Rate Doesn't Tell You
A 61.7% win rate sounds good. But if your average win is $50 and your average loss is $200, you're losing money despite winning most of your trades.
Win rate is only useful in context. On its own, it's one of the most misleading numbers in trading.
2. Risk-to-Reward Ratio (R:R)
R:R measures how much you make on winning trades relative to how much you lose on losing ones.
Formula: R:R = Average Winning Trade / Average Losing Trade
Or expressed as a ratio: if your average win is $150 and your average loss is $75, your R:R is 2:1 (or just "2R").
In practice:
- You risk $100 per trade (1R)
- Your target is $200 (2R)
- Your stop is $100 (1R)
- If the trade wins, you make 2R. If it loses, you lose 1R.
Planned R:R vs Achieved R:R
Most traders know their planned R:R (the ratio when they enter the trade). Fewer track their achieved R:R, what they actually made or lost after closing.
If your planned R:R is consistently 1:2 but your achieved R:R is closer to 1:1, that's a problem: you're cutting winners early or letting losses run. That gap between planned and achieved is one of the most valuable things a trading journal can reveal. For a deeper breakdown of why this ratio matters more than win rate on its own, see why your R:R ratio matters more than your win rate.
3. Expectancy
Expectancy is the most important number in trading. It tells you, on average, how much you make or lose per trade, and whether your system has a mathematical edge at all.
Formula: Expectancy = (Win Rate × Average Win) - (Loss Rate × Average Loss)
Or expressed in R: Expectancy = (Win Rate × Average Win R) - (Loss Rate × 1)
Example 1 (High win rate, low R:R):
- Win rate: 70%
- Average win: 0.8R
- Average loss: 1R
- Expectancy = (0.70 × 0.8) - (0.30 × 1) = 0.56 - 0.30 = +0.26R
Example 2 (Lower win rate, higher R:R):
- Win rate: 40%
- Average win: 2.5R
- Average loss: 1R
- Expectancy = (0.40 × 2.5) - (0.60 × 1) = 1.00 - 0.60 = +0.40R
Example 2 has a higher expectancy despite winning only 40% of trades. This surprises most traders when they first calculate it.
Negative expectancy example:
- Win rate: 55%
- Average win: 0.7R
- Average loss: 1R
- Expectancy = (0.55 × 0.7) - (0.45 × 1) = 0.385 - 0.45 = -0.065R
This trader wins more than they lose but is slowly losing money. Every trade they take costs them 0.065R on average. Without calculating expectancy, they might believe they have an edge.
Common Mistakes When Calculating These Numbers
Calculating win rate on too small a sample. Ten or fifteen trades tell you almost nothing. A strategy can look like it has a 70% win rate over 10 trades and be a coin flip over 100. Wait for at least 30 trades before drawing conclusions.
Using planned R:R instead of achieved R:R in your expectancy formula. If you plan for 1:2 but consistently exit winners early at 1:1, your real expectancy is lower than what your trading plan says on paper. Always calculate expectancy from what actually happened, not from your target.
Ignoring commissions and slippage. A strategy with a theoretical expectancy of +0.15R can turn negative once spread, commission, and slippage are factored in on every single trade. This matters more for high-frequency setups than for swing trades, but it should never be ignored.
Mixing setups together. Blending win rate and R:R across different setup types (say, a breakout strategy and a mean-reversion strategy) produces a number that doesn't represent either one accurately. Calculate these metrics per setup, not as one blended average.
A Full Worked Example
Here's how these three numbers work together using 12 trades from a single setup:
-
Trade 1: Win, +2.1R
-
Trade 2: Loss, -1R
-
Trade 3: Loss, -1R
-
Trade 4: Win, +1.8R
-
Trade 5: Win, +2.4R
-
Trade 6: Loss, -1R
-
Trade 7: Win, +1.5R
-
Trade 8: Loss, -1R
-
Trade 9: Loss, -1R
-
Trade 10: Win, +2.0R
-
Trade 11: Loss, -1R
-
Trade 12: Win, +1.9R
-
Winning trades: 6 out of 12 → Win Rate = 50%
-
Average win: (2.1+1.8+2.4+1.5+2.0+1.9) / 6 = 1.95R
-
Average loss: 1R (all losses were cut at the planned stop)
-
R:R = 1.95 : 1
-
Expectancy = (0.50 × 1.95) - (0.50 × 1) = 0.975 - 0.5 = +0.475R per trade
This trader wins exactly half their trades but has a strongly positive expectancy, because their average winner is nearly twice their average loser. Over 100 trades at this rate, that's roughly +47.5R of expected gain, before accounting for commissions and slippage.
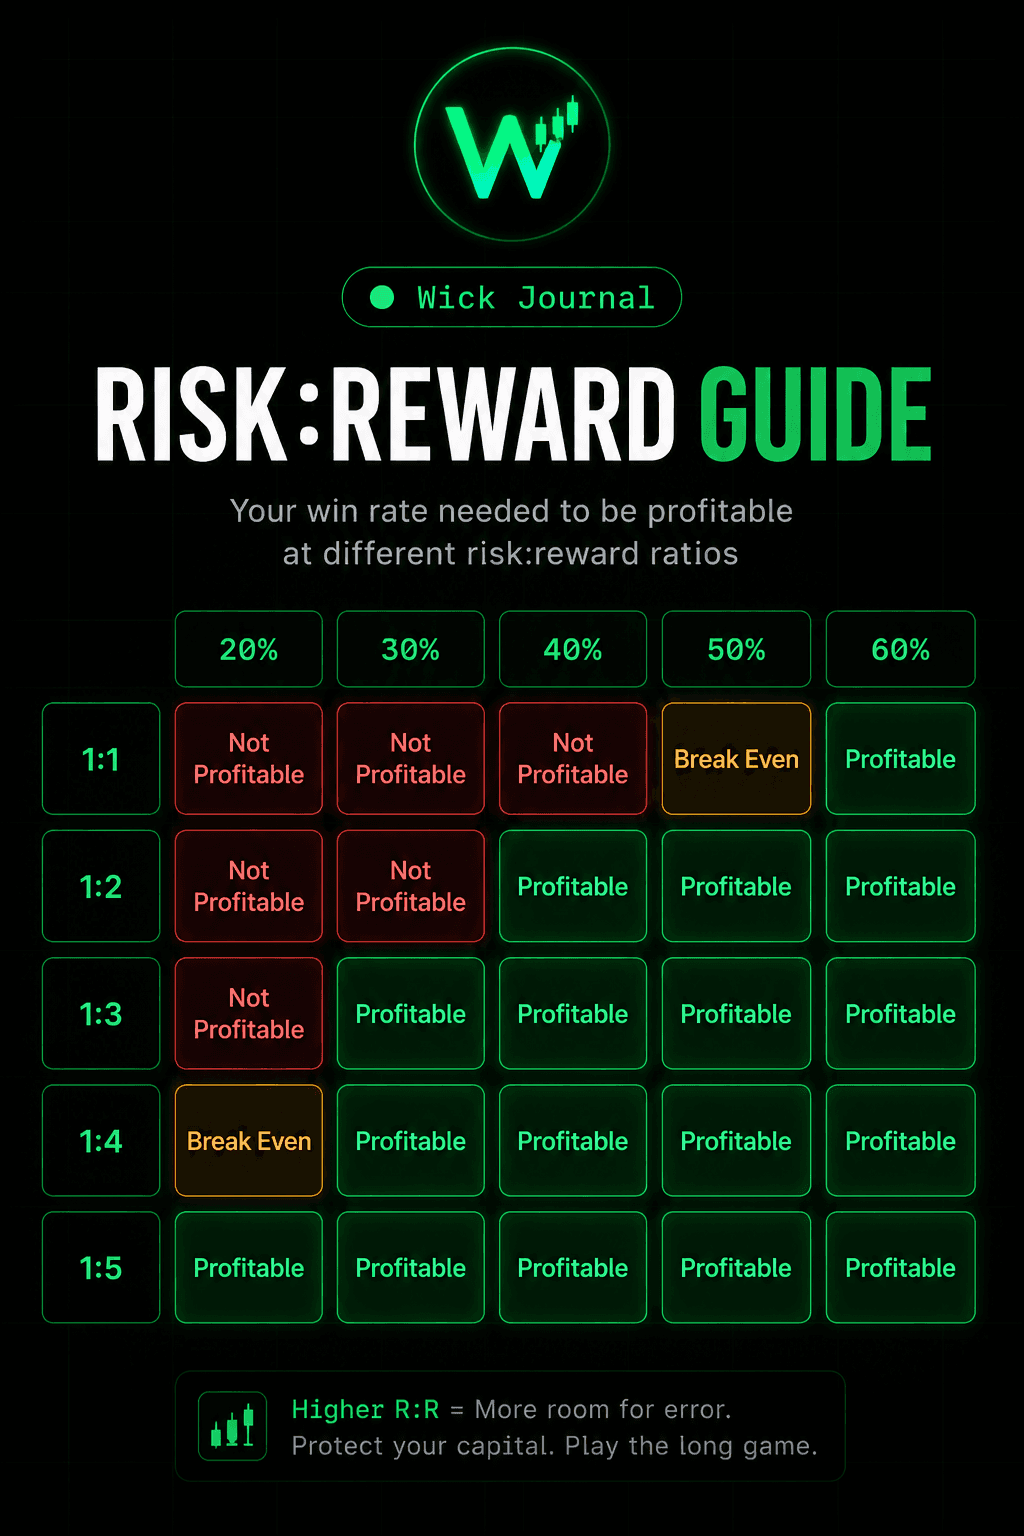
The Minimum Win Rate for a Given R:R
If you know your average R:R, you can calculate the minimum win rate you need to be profitable:
Formula: Minimum Win Rate = 1 / (1 + R:R)
- 1:0.5 → need to win 66.7%
- 1:1 → need to win 50%
- 1:1.5 → need to win 40%
- 1:2 → need to win 33.3%
- 1:2.5 → need to win 28.6%
- 1:3 → need to win 25%
- 1:4 → need to win 20%
A trader with a 1:3 R:R only needs to win 25% of trades to break even. A trader with a 1:0.5 R:R needs to win 67% just to stay flat.
How Many Trades Do You Need for Valid Stats?
This is where most traders make mistakes. They calculate their win rate over 15 or 20 trades and think they have meaningful data. They don't.
For statistically meaningful results:
- Minimum: 30 trades per setup or session
- Reliable: 50-100 trades
- High confidence: 100+ trades with consistent execution
Below 30 trades, random variance dominates. A good strategy can show a negative win rate over 15 trades. A bad strategy can look profitable over 20.
If you have fewer than 30 trades logged on a specific setup, you don't have an edge. You have a hypothesis. This is closely related to how many losing trades in a row is actually normal. A short losing streak inside a small sample doesn't mean your edge is broken.
How to Use These Numbers to Improve
Once you have enough data, the analysis becomes straightforward:
Step 1: Calculate expectancy for each setup type separately. A setup might show +0.4R expectancy while another shows -0.1R. Stop trading the negative-expectancy setup.
Step 2: Compare sessions. Your London trades might have +0.35R expectancy while your New York trades are flat. This alone can meaningfully improve your overall numbers.
Step 3: Track planned vs achieved R:R over time. If your achieved R:R is consistently below your planned R:R, focus on trade management before finding new setups.
Step 4: Set a minimum threshold. Many professional traders won't trade a setup unless their data shows at least +0.2R expectancy with 50+ samples. The threshold keeps them from trading noise.
The Numbers Wick Journal Calculates Automatically
Wick Journal tracks win rate, average R:R, and expectancy automatically, broken down by session and setup tag. When you log a trade from a screenshot, the data feeds directly into your dashboard.
The goal isn't to log trades. The goal is to accumulate enough clean data to answer one question: where is my edge, and where isn't it?
Across 350+ trades logged on the platform, the most common finding is asymmetric performance by session. Most traders perform significantly better in one session than others, but without the data, they trade all sessions equally, averaging down their best edge.
Win rate, R:R, and expectancy are the tools that make that visible.
Frequently Asked Questions
What is a good win rate in trading?
There's no universal "good" win rate. It depends entirely on your risk-to-reward ratio. A 70% win rate with a poor 1:0.5 R:R can lose money, while a 40% win rate with a 1:3 R:R can be highly profitable. Judge your win rate together with your expectancy, not on its own.
What's the difference between planned R:R and achieved R:R?
Planned R:R is the ratio you set when entering a trade (your target vs your stop). Achieved R:R is what you actually made or lost once the trade closed. A consistent gap between the two usually means you're cutting winners early or letting losses run past your plan.
How many trades do I need to calculate a reliable win rate?
At least 30 trades for a specific setup, ideally 50-100 for a more reliable read, and 100+ for high confidence. Below 30 trades, random variance can make a good strategy look bad, or a bad strategy look profitable.
Can a strategy have a high win rate and still lose money?
Yes. If your average loss is significantly larger than your average win, a high win rate isn't enough to offset it. This is why expectancy, not win rate alone, is the number that actually tells you if a strategy is profitable.
Related posts
How Many Trades Does It Take to Pass a Prop Firm Challenge?
Most challenges no longer have a deadline, which changes the question. The math behind whether your system…
Is a 40% Win Rate Good in Trading? (Real Example Inside)
A 40% win rate can be highly profitable. Here's the math, including a real 35% win rate system that stays…
Why Win Rate Doesn't Matter as Much as You Think
A high win rate can still lose money. See why risk-reward and expectancy decide if a strategy works, not how…